
How Greyhound Form Figures Work
Shorthand for a Dog’s Recent History
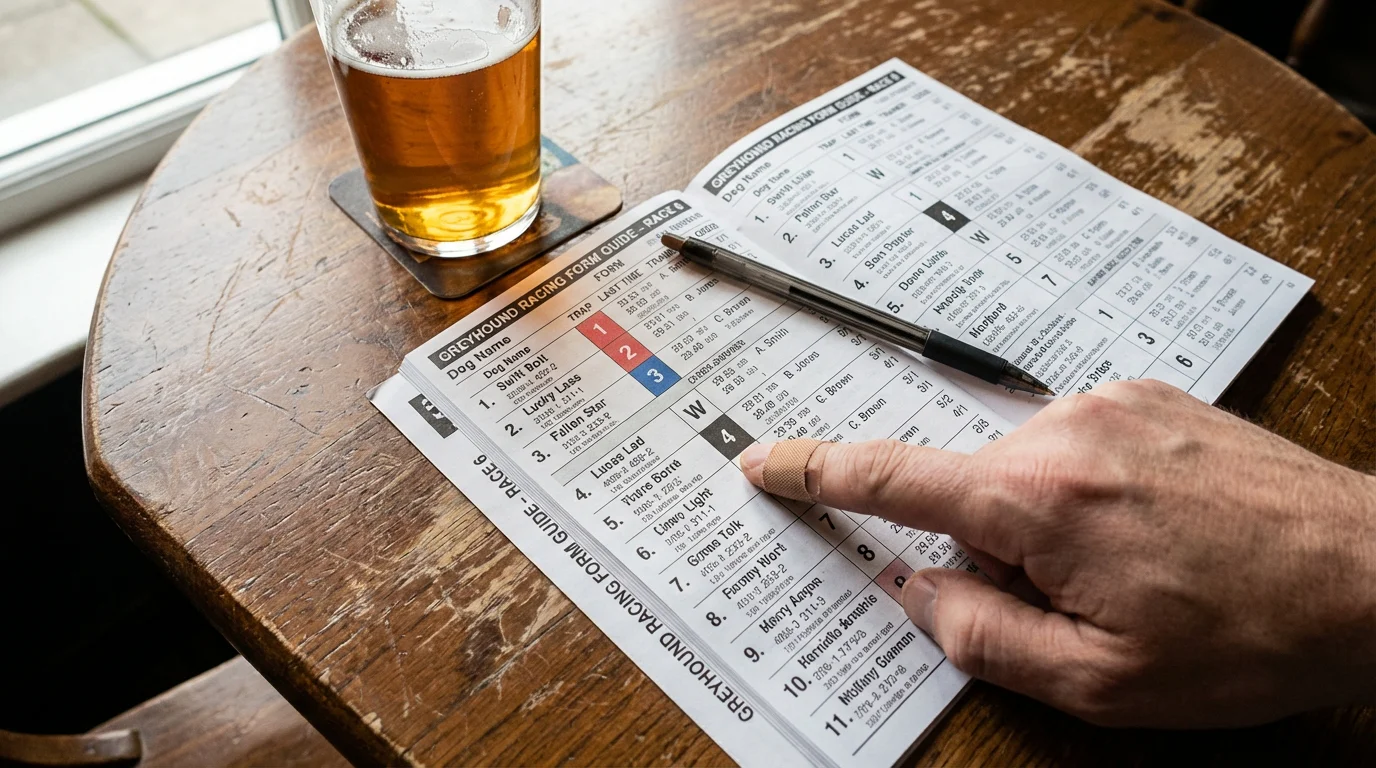
A string of numbers next to a dog’s name is shorthand for its entire recent history. Greyhound form figures are the first thing most punters look at on a racecard, and for good reason — they compress a dog’s last six races into a sequence of digits and letters that tell you, at a glance, whether it’s been winning, placing, struggling, or absent. But form figures are more nuanced than they appear. A sequence of 111111 doesn’t necessarily mean you’re looking at an unstoppable champion. A sequence of 443332 doesn’t necessarily mean you’re looking at a dog in decline. The figures are a starting point for analysis, not a conclusion.
In the context of the English Greyhound Derby, form figures carry particular weight because they chronicle a dog’s progression through the rounds of the competition. By the quarter-finals, each surviving dog has four Derby form figures — one for each round completed. Those figures, read together, tell a story about how the dog has handled Towcester, the sand surface, the quality of opposition, and the physical demands of weekly racing. Learning to read that story accurately is one of the most fundamental skills in Derby betting.
Apply form to your racecard reading in read racecard.
Every Figure and Letter, Explained
The core form figures are simple: they represent the finishing position in each race. A figure of 1 means the dog won. A figure of 2 means it finished second. The sequence continues through 3, 4, 5, and 6 for a standard six-dog race. The most recent result appears on the far right of the sequence, with older results to the left. So a form line of 321211 reads as: three races ago the dog finished second, then first, then first, then second, then first, then second — with the most recent run being a second-place finish.
Wait — that reading is wrong if you’re not careful about direction. Let’s be precise. A form line displays results from oldest on the left to most recent on the right. So 321211 means: the earliest of the six races shown was a third-place finish, followed by second, first, second, first, and most recently first. The dog’s current trajectory is improving — it won its last two starts.
Beyond the numerical positions, several letter codes appear in form figures to indicate specific circumstances. F means the dog fell during the race — a significant event that usually indicates interference at a bend, and one that can excuse an otherwise poor result. T means trap trouble: the dog was slow to leave the starting trap, either because of a mechanical issue with the trap itself or because the dog hesitated. A trap trouble note on a form line is worth investigating further — if it happened once, it might be a one-off; if it appears multiple times, the dog may have a trapping issue that will recur.
The letter S indicates the dog was slipped — released late from the traps due to a false start or re-run situation. D indicates a dead-heat for a finishing position. W is used by some race card compilers to denote a wide-running incident. A dash or hyphen (–) indicates a gap in racing, usually due to injury, rest, or a break for trialling. In Derby form, a dash between early-season races and the first round tells you the dog was rested in the lead-up to the competition — a signal that the trainer was deliberately freshening the dog for the challenge ahead.
The letter O occasionally appears in some racecard formats and indicates the dog ran but finished outside the placed positions — typically used for races with more than six runners. In the Derby context, where all heats are six-dog races, O is rarely relevant, but you may encounter it in a dog’s form from races at other tracks in the weeks before the competition.
Some racecards also display a trap number alongside or beneath the form figure, showing which trap the dog ran from in each race. This is valuable context: a dog that finished third from trap 6 may have run a stronger race than a dog that won from trap 1, because the wide draw is inherently more challenging. The combination of finishing position and trap draw gives a much fuller picture of performance than the form figure alone.
Reading Patterns in Form
The real analytical value of form figures emerges when you read them as patterns rather than individual results. A sequence that shows consistent improvement — 432211, for instance — suggests a dog that’s progressively finding its level and may not yet have reached its peak. In a Derby context, this is the pattern you want to see. A dog entering the quarter-finals in better form than it showed in round one is a dog moving in the right direction at the right time.
Declining form — 112234, for example — tells the opposite story. The dog was at its best three or four runs ago and has been unable to maintain that standard. In the Derby, declining form across rounds can indicate fatigue, the cumulative toll of weekly racing on sand, or simply that the dog has hit its ceiling and the improving quality of opposition has found it out. Backing a dog with declining form to reverse the trend in a quarter-final or semi-final is a bet against the evidence.
Consistent form — 222122 or 111211 — tells you the dog performs at a reliable level regardless of draw, conditions, or opposition. Consistency is undervalued by many punters who focus on identifying winners rather than reliable performers. In a six-round knockout, consistency keeps you in the competition. A dog that finishes second or third in every round reaches the semi-final; a dog that alternates between winning and finishing fifth may not survive the early rounds.
Erratic form — 152413, where the dog oscillates between strong and weak performances — is the hardest pattern to bet on. The form figures tell you the talent is there (the ones and twos) but so is the risk (the fours and fives). Erratic form often indicates a dog that’s affected by the draw, by pace in the race, or by temperament issues that make its performance unpredictable. In the Derby, where every round is an elimination, erratic dogs are a gamble — they might produce a career-best performance in the final, or they might exit in round two with a fifth-place finish that nobody can explain.
One pattern-reading technique that separates sharp bettors from casual ones is comparing form figures with finishing times. A dog with form figures of 3324 looks like it’s struggling. But if its finishing times across those four runs are 29.10, 29.05, 29.02, 28.98, the picture changes entirely — the dog is running faster every round despite not winning. The reason for the finishing positions might be draw-related, or it might be running into the form of exceptional opponents. The form figures suggest decline. The times suggest improvement. The smart money follows the times.
From Figures to Edge
Form figures are the most accessible data point on the racecard, which means they’re the one most fully priced into the market. A dog showing 111111 will be short in the betting because every punter can see the winning sequence. The edge doesn’t come from reading the figures — it comes from reading beyond them. Cross-referencing figures with times, draws, and visual observations from streaming creates a multidimensional assessment that the headline form figure alone can’t capture.
In the Derby, where you have round-by-round data accumulating across six weeks, the opportunity to read form figures in context is richer than in any standard meeting. Use that opportunity. Track each dog’s figures across rounds. Compare them with times. Factor in the draw. And treat the figures as the beginning of your analysis, not the end of it.
Learn to read form figures on the greyhoundderbybetting homepage.